EUR/USD remains under pressure - Commerzbank
Karen Jones, Head of FICC Technical Analysis Research at Commerzbank, noted the pair still remains vulnerable.?EUR/USD came under renewed downside pressure on Friday but swiftly recovered. Attention has reverted to the 1.1275 resistance line and 1.1285 15th September high. This protects the 1.1366 August high. Only an unexpected rise above here would introduce scope to 1.1416/65, the mid-April and June highs. We have no strong bias here?.?Failure at 1.1275/85 will retarget the 1.1123 31st August low. Below here, the seven month support line at 1.0996 will be targeted next, together with the June and July lows at 1.0952/12?.
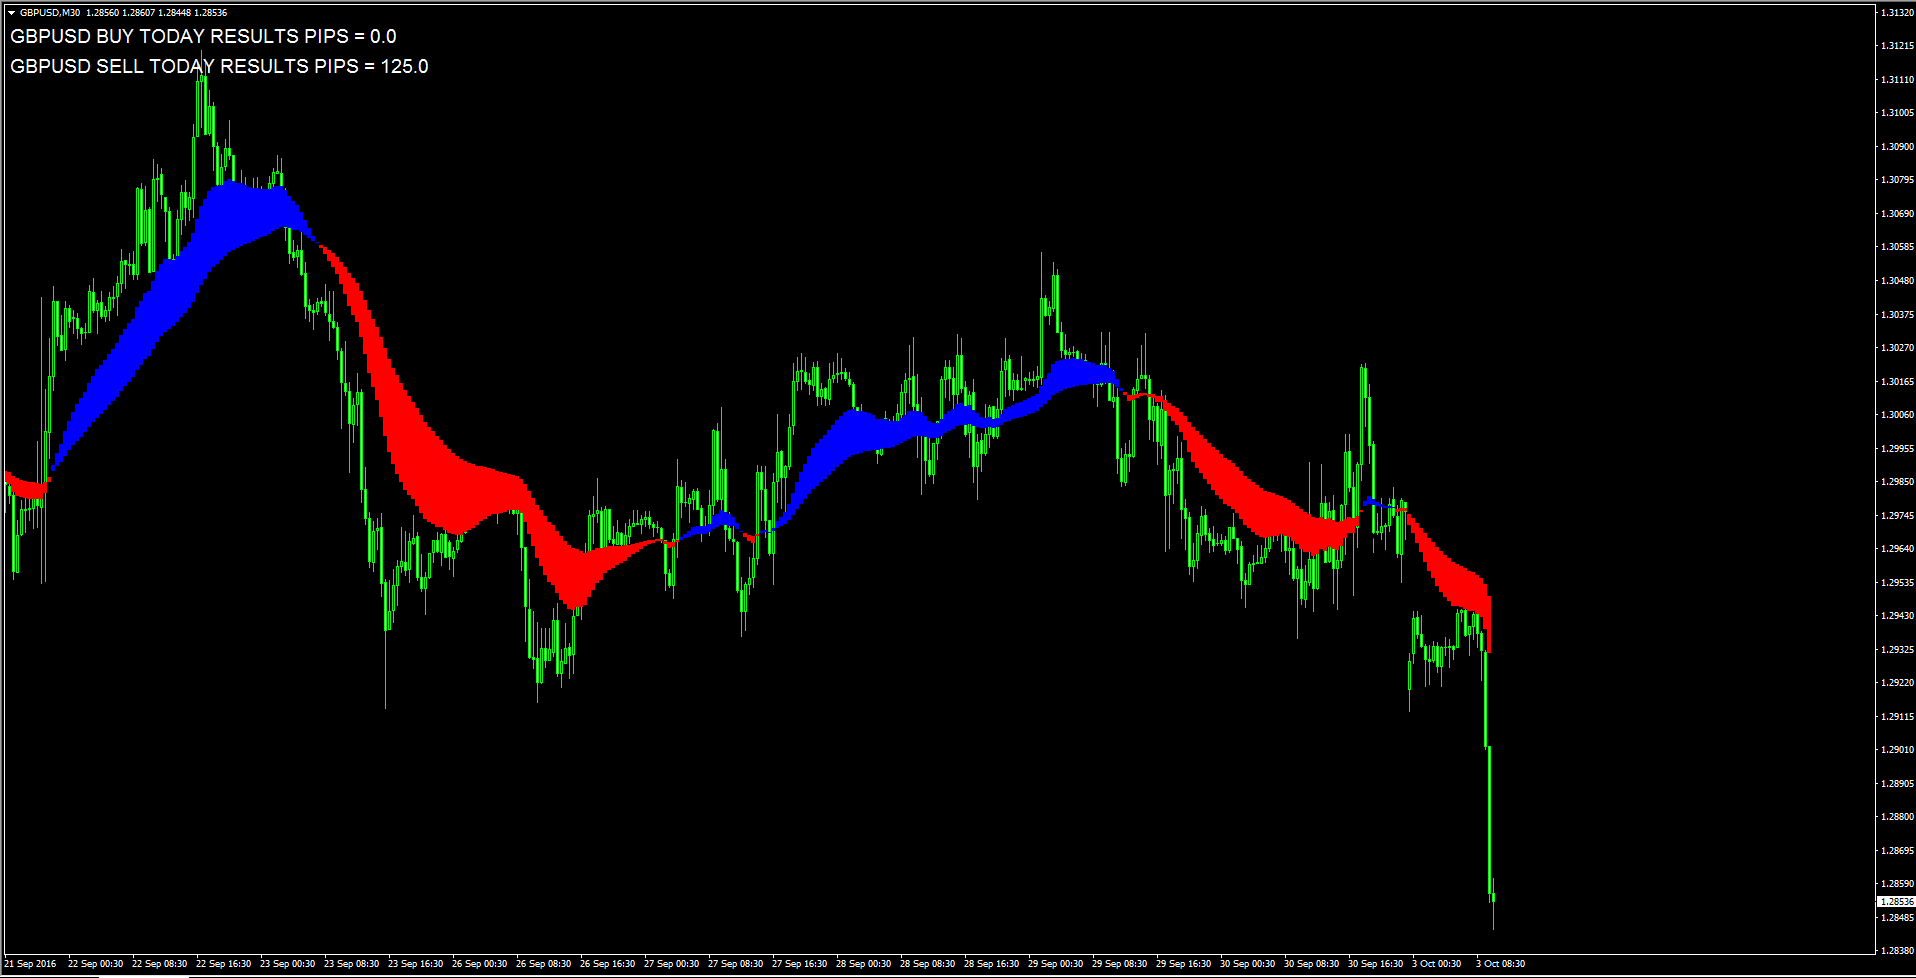
UK manufacturing PMI preview: What to expect of GBP/USD?
UK manufacturing PMI for September due for release today, is expected to show the pace of expansion in the activity moderated somewhat. The index is seen coming-in at 52.1 versus August?s 53.3 reading. A better manufacturing PMI print would send the spot back onto 1.29 handle and beyond. On the other hand, a weaker-than-expected figure could push the cable further southwards in a bid to 1.2850 levels.Should the PMI figure surprise markets positively, the bulls would be offered some respite from the Brexit fears-led heavy selling witnessed in the GBP/USD pair so far this Monday.Danske Research Team noted, ?In the UK, PMI manufacturing data is due out. The PMI rebounded significantly in August after falling sharply in July just after the vote. Consensus is for a drop to 52 in September versus 53.3 in August.?Analysts at TDS see the UK?s September manufacturing PMI to increase to 54.0 vs consensus of a decline to 52.1. ?This pickup is underpinned by the CBI survey?s continued improvement in expected sales volumes, alongside some support from the flash European manufacturing PMIs, which pointed to further expansion in the sector in September.? Haresh Menghani. Analyst at FXStreet explains, ?The pair?s rebound from 1.2915 support area now seems to confront immediate resistance near 1.2975 above which the recovery momentum could get extended towards testing a short-term descending trend-channel resistance near 1.3000 psychological mark.??Meanwhile on the downside, weakness below 1.2915 support might now accelerate the slide immediately below 1.2900 handle towards August monthly lows support near 1.2870. The downslide could further get extended towards testing the descending trend-channel support near 1.2750 region with 1.2800 round figure mark acting as intermediate support.?
AUD/USD confined in a narrow trading range around 0.7650
The AUD/USD pair was seen struggling to build on to Friday's sharp rebound from 50-day SMA and traded with slight negative bias around 0.7650 region.The pair on Friday caught up strong bids around 50-day SMA support after easing Deutsche Bank concerns lifted investor risk-appetite and boosted demand for higher-yielding currencies - like Aussie.On the first trading day of a new trading week, the pair was confined within a narrow trading band despite of the prevalent risk-on environment as traders look forward to RBA monetary policy decision on Tuesday and a slew of Australian macro releases slated for release during the course of current trading week. In the meantime, today's release of US ISM manufacturing PMI would assist traders to grab some short-term trading opportunities, while broader risk sentiment might also provide some impetus for the pair. Immediate upside resistance is seen at 0.7670 (Friday's high) above which the pair is likely to make an attempt towards reclaiming 0.7700 handle. A follow through buying interest above 0.7700 handle seems to boost the pair back towards 0.7732 (Sept. 8 high) ahead of a major upside hurdle near 0.7750.On the flip side, weakness below 0.7630 immediate support should drag the pair back towards 50-day SMA support, currently near 0.7600 handle, which if broken decisively now seems to turn the pair vulnerable to head towards testing its next major support near 0.7535 level.
USD/CAD losing the grip near 1.3120, eyes on US ISM
The Canadian dollar is posting meagre gains vs. its neighbor on Monday, sending USD/CAD to the 1.3120/15 band for the time being.The pair manages to keep the trade above the 1.3100 handle so far, against the backdrop of a mild bias favouring the greenback and crude oil prices trading slightly in the red territory.The barrel of West Texas Intermediate remains in the upper end of the recent range, meandering around the $48.00 mark and following last week?s data, which showed inventories decreasing by more than 1.8 million barrels and oil rigs count up by seven to 425.Ahead in the session, RBC?s Manufacturing PMI is only due in Canada, while ISM Manufacturing and Markit?s PMI are expected in the US docket.Regarding positioning, speculative money has taken CAD back to the net short area for the first time since March 29, while Open Interest are at their lowest levels since that time.As of writing the pair is losing 0.05% at 1.3120 facing the next support at 1.3059 (55-day sma) followed by 1.2996 (low Sep.22) and then 1.2818 (low Sep.7). On the other hand, a break above 1.3276 (high Sep.27) would open the door to 1.3311 (38.2% Fibo of the 2016 drop) and finally 1.3575 (50% Fibo of the 2016 drop).
USD/JPY turns flat at 101.30
Having posted a session high at 101.65 level, the USD/JPY pair failed to extend the momentum and has now reversed all of its early recovery gains to currently trade around 101.30 region. The prevalent risk-on sentiment initially helped the pair to continue with its upward trajectory for the fifth trading session. Moreover, the disappointing release of Tankan Manufacturing Index from Japan also contributed to the offered tone around the Japanese Yen. Further upside, however, was restricted amid renewed Brexit fears, which is seen extending some support to the safe-haven appeal of the Japanese Yen and restricted the pair below 50-day SMA immediate resistance. Looking ahead today's release of US ISM manufacturing PMI is likely to provide fresh impetus during NA trading session, while the prevalent risk sentiment would continue to be the key driver for the pair's next leg of move during European session. Weakness below session low support near 101.20 level is likely to accelerate the slide immediately to 101.00 handle below which the pair is seems to head back towards 100.70 support en-route 100.30 important horizontal support.On the flip side, 101.60 area now seems to have emerged as immediate resistance and is closely followed by 50-day SMA strong resistance near 101.75-80 region. A convincing strength above 50-day SMA resistance should now pave way for continuation of the pair's near-term recovery trend towards its next major resistance near 102.50-60 region in the near-term.
Oil retreats from multi-week tops, Brent tests $ 50 mark
Oil prices on both sides of the Atlantic halted its recent run of gains and dropped Monday, mainly on the back of fresh reports of record high OPEC output as well as on profit-taking.Currently, both crude benchmarks keep losses, with Brent down -0.33% at $ 50, while WTI drops -0.50% to test $ 48 barrier. The bulls take a breather after the recent upsurge, knocking-off oil in the red as oversupply worries resurface; despite last week?s OPEC oil output cut agreement.On Friday, a Reuters survey revealed that OPEC's oil output is likely to reach 33.60 million bpd in September from a revised 33.53 million bpd in August, its highest in recent history.Moreover, continued increase in the US rigs count data last week, also dampened the sentiment around oil markets. According to oil-field services company Baker Hughes Inc, the number of rigs drilling for oil in the US climbed by 7 in the past week to 425.Additionally, re-emergence of Brexit fears into the markets, after British PM May said that the Article 50 will be triggered by March 2017, crushed risk appetite and weighed on the risk-assets such as oil.Looking ahead, focus remains on the weekly crude supply reports due out from both the API and EIA later this week.Carol Harmer noted, ?We would be looking at a correction lasting a few days to eases this overbought scenario and the downside target would then be in the 46.20/45.65 area...A move back towards this support would be good for the market and if we are to continue to trade higher we would then be in a good position to move higher and tak out the 48.65 resistance....and try and aim for the 49.95 to 50.65 area..??Can we take out the latter level...well we would need much effort from the buyers to be able to do this and we would then see the sellers dissolve above 51.90 as they would then be aware that we can trade higher and look to the 54.00 resistance area...?
Disclaimer: This material is provided as a general marketing communication for information purposes only and does not constitute an independent investment research. All information provided is gathered from reputable sources and any information containing an indication of past performance is not a guarantee or reliable indicator of future performance. We assume no liability for any loss arising from any investment made based on the information provided in this communication.